How to Measure Content Performance Beyond Views
Learn how to measure content performance with our guide on setting meaningful KPIs, using analytics, and proving ROI to drive real business growth.


It’s tempting to chase big numbers. We all love seeing a spike in page views. But when it comes to measuring content performance that actually matters, we have to look past those surface-level stats and dig into the metrics that directly impact our business goals.
It's about a fundamental shift in perspective: from asking "how many people saw this?" to "what did this content achieve?"
Why Traditional Content Metrics Fall Short

We've all been there. You publish a blog post, it gets a ton of traffic, and for a moment, it feels like a massive win. But what if those thousands of visitors hit the back button within seconds? What if none of them signed up for your newsletter, downloaded your guide, or ever came back?
This is the classic trap of vanity metrics. They feel good, but they don't tell the whole story. Traffic, social shares, and even bounce rate can be incredibly misleading. User behavior is more complex than ever, and with growing privacy restrictions, these shallow metrics are losing what little reliability they had.
A high page view count doesn't mean you reached the right people. It certainly doesn't mean your content was valuable to them.
Vanity Metrics vs. Actionable Metrics
Distinguishing between what looks good and what actually drives results is crucial. This table breaks down the difference between vanity metrics and the actionable metrics you should be focusing on.
| Metric Type | Example Metric | What It Measures | Why It's Limited |
|---|---|---|---|
| Vanity | Page Views | The total number of times a page was loaded. | Doesn't indicate user engagement, satisfaction, or if the right audience was reached. |
| Actionable | Engaged Sessions | Visits with meaningful interaction (e.g., >10s duration, conversion event, multiple page views). | Shows genuine interest and filters out bounces, providing a clearer view of audience quality. |
| Vanity | Social Shares | The number of times content was shared on social media platforms. | Lacks context. A share doesn't guarantee the content was read, understood, or drove traffic. |
| Actionable | Conversion Rate | The percentage of users who completed a desired action (e.g., form submission, download). | Directly links content performance to a specific business goal, demonstrating tangible value. |
Focusing on actionable metrics allows you to build a content strategy that proves its worth, moving beyond guesswork and into data-driven decisions that deliver real impact.
The Critical Shift to Engagement
The industry is moving past simple visibility. As of 2025, top marketers are zeroing in on metrics like “engaged sessions”—visits that last longer than 10 seconds and involve a meaningful interaction. This is a much better indicator of genuine interest than a fleeting visit that just inflates your traffic stats.
This new mindset forces you to ask better questions:
- Did users actually interact with the page elements?
- Did this piece of content move them to the next step?
- Did it contribute to a tangible business outcome?
The goal isn't just to attract eyeballs; it's to attract the right eyeballs and guide them toward a meaningful action. A single conversion from a well-targeted article is often more valuable than a thousand views from an irrelevant audience.
Moving Beyond Surface-Level Data
Think about a highly technical guide you might write, like a deep dive into selecting an open-source content management system. This kind of post will likely never go viral or pull in massive traffic numbers.
But if it attracts a handful of senior developers who then book a consultation with your sales team, that single piece of content is incredibly valuable. Judging it by page views alone would completely miss the mark and label a high-performing asset a failure.
This is why we have to connect our content analytics to real business outcomes. When you stop chasing vanity metrics, you start building a smarter, more resilient content strategy—one that you can confidently say is driving growth and justifying every bit of investment.
Connecting Content KPIs to Business Goals
Before you even think about opening an analytics dashboard, you need to ask a fundamental question: what does success actually look like for this business? If you can’t answer that, you’re just tracking vanity metrics in a vacuum. Your content KPIs have to be a direct reflection of your company's bigger picture.
For instance, let's say the company's main goal is to expand market share in the Pacific Northwest. A relevant content KPI isn't just "more traffic." It's an increase in organic traffic from users in Washington and Oregon. Or, if the business objective is to shorten the sales cycle, you shouldn't be obsessed with lead volume; you should be measuring content-influenced pipeline velocity.
When you approach it this way, every article, video, or whitepaper you create has a clear purpose tied to a tangible business outcome. Suddenly, proving your content's value gets a whole lot easier.
Aligning Metrics with Business Models
The right KPIs are never one-size-fits-all; they are completely dependent on your business model. A SaaS company and an e-commerce store value wildly different outcomes, so a generic measurement strategy is doomed to fail. You have to customize your approach to what actually moves the needle for your business.
Let’s look at a couple of real-world scenarios:
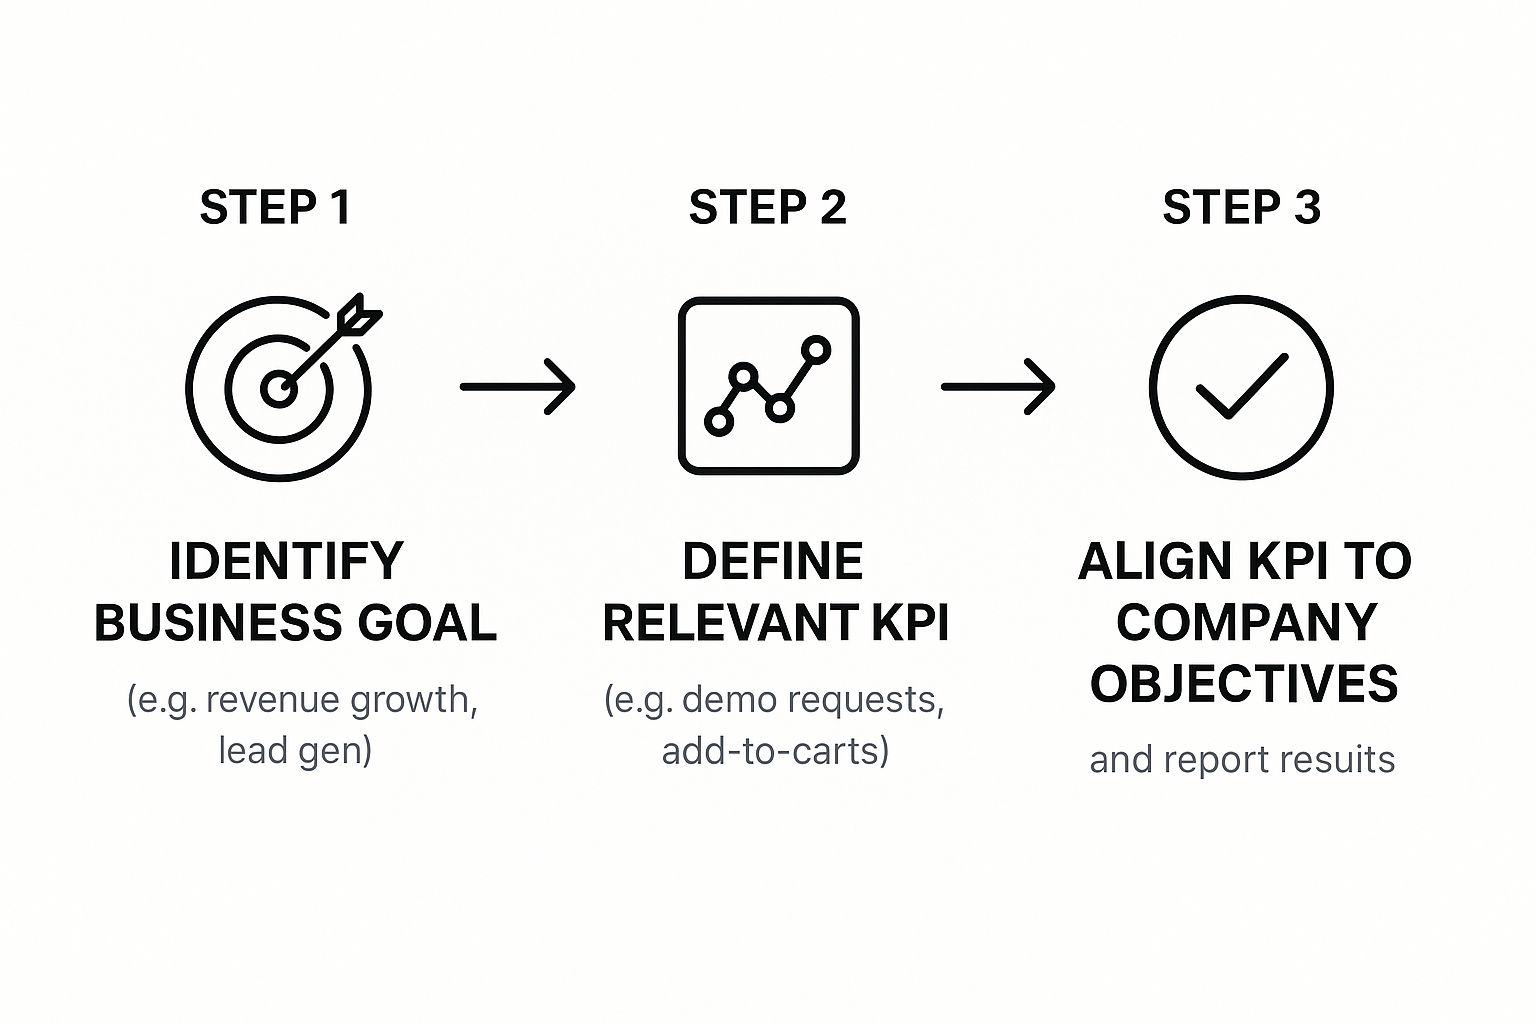
- For a SaaS Company: Your world probably revolves around feeding the sales team high-quality leads. Success isn't about blog views. It's about the number of demo requests, free trial sign-ups, and Marketing Qualified Leads (MQLs) your content generates.
- For an E-commerce Brand: Here, the finish line is a sale. You should be tracking metrics like the add-to-cart rate from a product-focused blog post, the attributed sales revenue from your content, and the conversion rate of visitors who read a guide before buying something.
This simple infographic breaks down that workflow, showing how to connect those high-level business goals directly to specific content metrics.
The key takeaway here is that your content metrics only become meaningful when you can map them back to an objective that the rest of the business—especially the leadership team—actually understands and cares about.
Building a Reporting Framework That Resonates
Once you’ve defined your goal-oriented KPIs, the next challenge is building a reporting structure that clearly communicates their value. The tools you use are critical here. You need a platform that can actually track these nuanced metrics, and our detailed content management system comparison is a great place to start looking for one that fits your analytics needs.
By translating content performance into the language of business—leads, sales, and customer loyalty—you shift the conversation from "how much traffic did we get?" to "how much revenue did this content generate?"
This strategic alignment is the difference between content that just exists and content that actively fuels business growth. It gives you the hard data you need to justify your budget, inform your strategy, and prove that content marketing isn't just a "nice-to-have," but a core driver of the entire organization.
Building Your Measurement and Analytics Stack
Now that you have your KPIs locked in, it's time to build the tech that will actually track them. A basic Google Analytics setup is a good start, but it's just that—a start. If you really want to understand how your content performs, you need a connected system. Think of it as an analytics "stack" that follows a person's entire journey, not just their first click.
The real goal here is to stop looking at isolated metrics like page views and start connecting the dots between content and real business outcomes. This means you have to get your core analytics platform talking to other key tools, especially your CRM (think HubSpot or Salesforce). That’s the magic connection that shows you which blog post led to a demo request or how a whitepaper influenced a final sale.
Core Components of a Powerful Analytics Stack
A solid measurement stack usually has a few layers that work together. Each one gives you a different piece of the puzzle, so you end up with a complete picture of how people engage with your content and move through your funnel.
- Analytics Platform: For most of us, Google Analytics 4 (GA4) is the foundation. It’s where you’ll track your website traffic, user behavior, and on-site events.
- CRM Integration: For any B2B company, this is non-negotiable. It’s what links anonymous website visitors to known leads and customers in your database, directly tying content to pipeline and revenue.
- Data Visualization Tool: Tools like Looker Studio or Tableau are fantastic for turning a mountain of data into a clear, concise performance snapshot. They let you build custom dashboards that only show the KPIs you truly care about.
Here’s a look at a standard Google Analytics dashboard. It gives you a nice, high-level overview of where your users are coming from and how they're engaging.

While this is a helpful starting point, the default view barely scratches the surface. The real power comes when you customize it and start pulling in data from your other tools.
Setting Up for Success
To get data you can actually trust, you have to be meticulous with your setup. This means properly configuring goals, setting up custom events, and—this is a big one—using systematic UTM parameters. UTMs are just tags you add to your URLs to track exactly which channels, campaigns, and even specific links are driving your traffic. A consistent UTM strategy is the only way to definitively know whether your LinkedIn campaign outperformed your email newsletter.
Don't forget that the structure of your website itself plays a huge role. Choosing the right platform from the start is fundamental, which is something we cover in our guide on selecting a https://www.contenttoolkit.co/blog/website-builder-and-cms that actually supports deep analytics.
Remember, the point of your analytics stack isn't just to collect data—it's to collect the right data. A well-configured system automates the tedious work of connecting content efforts to revenue, making your reporting both accurate and incredibly powerful.
This shift toward business results isn't just a hunch; it's a clear trend. Over 41% of marketers now point to sales growth as their primary measure of content success, a major change from a few years ago when traffic was king. To really get this right, you'll need a solid grasp of the whole process. This comprehensive guide on measuring content performance is a great resource for essential tips and tools to build out your stack effectively.
How to Analyze Data and Find Actionable Insights
Collecting data is just the starting line. The real magic happens when you can look at a spreadsheet or an analytics dashboard and see the story unfolding behind the numbers. Raw data is just noise; the goal is to find actionable insights that push your strategy forward.
It’s all about shifting from reporting what happened to understanding why it happened. This is where you draw a clear line between user behavior and your content, letting you diagnose performance issues and, more importantly, spot opportunities.
Diagnosing Common Performance Scenarios
Let's unpack a classic (and often frustrating) scenario. You've published a blog post with a fantastic average time on page—we're talking over five minutes. People are definitely engaged. But when you look at the conversion rate, it's practically zero. No one is clicking your call-to-action (CTA) or signing up for that demo.
So, what's going on? A few things could be at play here:
- Content-Audience Mismatch: The article might be attracting an audience that's genuinely curious about the topic but isn't your ideal customer. They love the information but simply don't need your product.
- Poor CTA Placement: Is your CTA buried at the bottom of a 3,000-word beast? Even engaged readers might not make it all the way down. Tools like heatmaps are perfect for figuring this out.
- Uncompelling Offer: The content delivers value, but the offer in your CTA feels like a non-sequitur. The jump from the information they just read to the action you want them to take feels jarring or completely irrelevant.
True analysis isn't about finding a single "correct" answer. It's about forming solid hypotheses based on the data, then running tests to see which changes actually move the needle.
Uncovering Deeper Trends with Segmentation
If you're looking at your audience as one giant, uniform group, you're missing the most important details. The secret to finding much richer insights is segmentation—slicing up your data to see how different groups of users behave.
For example, don't just look at your overall traffic. Segment it. You might find that visitors from organic search convert at 3%, while traffic from that new social media campaign is converting at a measly 0.2%. Right away, you know where to double down on your efforts.
Here are a few powerful ways to start segmenting your data:
- By Channel: Compare how users arriving from organic search, paid ads, social media, and email newsletters interact with your content differently.
- By Device: Are mobile users bouncing faster or converting less often than desktop users? That could signal a clunky mobile experience that needs fixing.
- By Demographics: Look at how different age groups or people in specific countries engage with your site. You might discover a particular article is a surprise hit with an audience you weren't even targeting.
This kind of granular analysis is what allows you to really fine-tune your content strategy. Let's say you find that your long-form guides do incredibly well with organic search traffic but die on social media. The answer isn't to stop promoting them on social; it's to create bite-sized infographics or short video clips specifically for those channels.
Managing all this segmented content can get complicated, which is why many teams rely on specialized tools. If you're looking for a system to handle this, you can browse through this directory of knowledge base CMS platforms to see what's out there.
By digging into these patterns, you stop making broad, vague assumptions. Instead, you start making sharp, informed decisions based on how specific groups of people actually behave. This is how you turn a pile of raw data into a clear roadmap for what to do next.
Calculating the True ROI of Your Content
https://www.youtube.com/embed/j1CNmi302Oc
Eventually, the big question always comes from leadership: "What's the return on our investment?" This is where your measurement strategy shifts from tracking engagement to proving financial impact. Calculating content ROI is about translating your efforts into the language executives understand and respect.
The whole point of measuring content performance is to connect it back to the bottom line. If you need a solid primer, this piece on What Is Return on Investment and How Do You Use It offers a fantastic overview. The formula itself is simple, but the real work lies in accurately tracking every dollar in and every dollar out.
Tallying Up the Total Investment
You can't calculate your return without a completely honest look at your investment. This goes way beyond the invoices you pay to freelancers. You need a full accounting of every resource poured into creating and promoting your content.
Make sure your total investment includes:
- Team Salaries: Prorated salaries for your in-house writers, editors, designers, and strategists.
- Software and Tools: All the subscriptions for your CMS, analytics platforms, SEO tools, and design software.
- Freelance and Agency Fees: Every payment made to external writers, designers, or agencies.
- Promotion Budget: The actual cash you spent on paid ads, social media boosts, or influencer campaigns.
Only when you capture the total cost can you get a true picture of your content's financial performance.
Attributing Revenue to Content
This is where things get tricky. How do you definitively say that a specific blog post led to a sale? The key is to pick an attribution model that actually reflects how your customers buy.
- First-Touch Attribution: This model gives 100% of the credit to the very first piece of content a customer ever saw. It’s perfect for understanding what content is bringing new people into your orbit.
- Last-Touch Attribution: Here, the final piece of content someone engaged with before buying gets all the credit. This model highlights the assets that are great at closing deals.
- Multi-Touch Attribution: This is easily the most sophisticated approach. It spreads the credit across multiple touchpoints, recognizing that a single purchase is often the result of several interactions over time.
Think about a B2B company. A deep-dive whitepaper might have generated the initial lead (first touch), but a simple product comparison guide was the last thing they read before requesting a demo (last touch). A multi-touch model would wisely give partial credit to both.
A common mistake is to only focus on content that directly generates leads. Many of your best pieces will assist conversions indirectly, building trust and authority over time. Don't discount their value.
An e-commerce business using a powerful CMS for ecommerce can track how a "Top 10 Gadgets" blog post directly influences add-to-cart actions, making revenue attribution much more straightforward.
According to 2025 industry benchmarks, the average content ROI for tech and retail sectors hovers between 150% and 300%. The real top performers? They're seeing over 500% ROI. When you can tie every dollar spent to revenue earned, you're not just running a content program—you're building an undeniable business case for it.
Turning Performance Data into Optimization Actions

This is where the rubber meets the road. All the data you’ve so carefully collected is just a pile of numbers until you use it to make something better. Effective measurement isn’t about creating a final report to file away; it’s the starting gun for a continuous cycle of improvement.
This is how you close the loop—turning insights into real-world optimizations that make your entire content strategy sharper and more efficient. It’s not about huge, dramatic overhauls. It’s about making a series of small, data-backed hypotheses and testing them. The aim is to build a living library of content that gets better and better, month after month.
Creating Your Content Optimization Roadmap
An optimization roadmap is your battle plan for systematically improving your existing content. Instead of just randomly picking articles to update, you need to prioritize based on potential impact. This is what separates strategic content teams from the rest—they focus their energy where it will deliver the biggest wins.
A great way to start is by sorting your content into a few buckets based on performance. You’ll probably see some familiar patterns emerge, each pointing to a different kind of action.
- High Traffic, Low Conversions: These pages are magnets for visitors but aren't compelling them to take the next step. I always mark these as top priority for optimization.
- High Engagement, Low Traffic: These are your hidden gems. The content clearly hits the mark with the small audience it reaches, so the whole game here is about improving its visibility.
- High-Performing Outliers: These are your rockstars. The goal isn't just to keep them fresh; it's to figure out why they work and replicate that success in new formats.
Your data shouldn’t just live in a dashboard. It should fuel an ongoing process of testing and refinement, turning every piece of content into a performance asset.
Practical Strategies for Optimization
Once you’ve got your priority list, you can start applying specific tactics. The trick is to match the solution to the problem your data has uncovered.
Let’s take that article with high traffic but low conversions. The culprit is often a weak call-to-action (CTA). Instead of a vague "Contact Us," try something directly related to the content, like "Download the Free Checklist." I’ve seen this one change alone double conversion rates. You could also:
- A/B test your headlines to see if a different angle can improve the click-through rate from search results.
- Rewrite the introduction to hook the reader faster and align more tightly with their search intent, which can do wonders for your bounce rate.
- Update old statistics and examples. Nothing kills authority faster than outdated information.
Now, for that piece with high engagement but low traffic, the issue is almost always distribution and SEO. Your focus should be on building more internal links from your high-traffic pages, beefing up its on-page SEO, and maybe even launching a small promotional campaign to get it in front of a new audience.
Repurposing Your Top Performers
Never let your best content sit idle after its initial splash. A high-performing article is basically a proven concept, a free piece of market research telling you what your audience loves. You can—and should—expand on it to reach entirely new segments.
I’ve had a lot of success with these kinds of repurposing plays:
- Transform a detailed guide into a webinar: This caters to a different learning style and is fantastic for capturing high-intent leads.
- Break down a long-form article into an infographic or a series of social media posts: This makes your core ideas more shareable and digestible for a broader audience.
- Turn a successful case study into a short video testimonial: This adds a powerful layer of social proof that a text-only page just can't match.
By building a repeatable process for optimization, you stop chasing one-off viral hits. Instead, you build a powerful content engine where every single piece is continuously improved, driving predictable, sustainable growth.